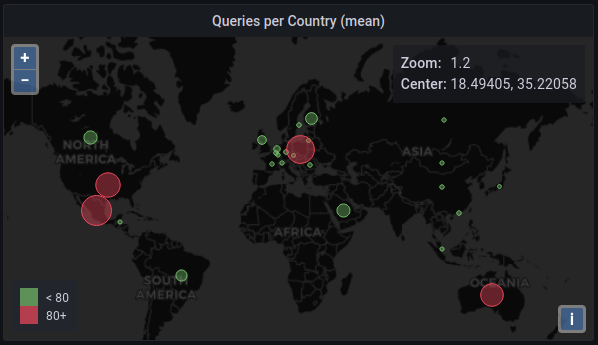
Grafana Geomap of queries per country
This wiki is out-of-date as it's now part of DSC example dashboards 2.0
There is now a Geomap Panel (beta) in Grafana and it can be used together with the client_subnet dataset in DSC and the client_subnet_country generator in dsc-datatool to show where queries comes from, and here is how you can set it up.
If you have a setup following this wiki then you can skip to Setting up Grafana.
You can use the sample configuration for this dataset:
dataset client_subnet dns All:null ClientSubnet:client_subnet queries-only max-cells=200;
This will store a query count for the first 200 client subnets DSC sees per output interval.
The option you need to add to dsc-datatool is the following:
--generator client_subnet_country
You also need to have MaxMind databases available on your system, an example on setting that up can be found here. That wiki can also show you how to setup dsc-datatool if you don't already have.
IMPORTANT: If you didn't use the DSC dataset client_subnet you might want to remove some of the generated data since dsc-datatool will export all datasets it sees. So edit the influx.txt in some way and remove everything starting with client_subnet, (note the comma otherwise you might remove client_subnet_country also).
You can now create a new panel and select the Geomap visualization:
- Add a new empty panel
- Change visualization from Time Series to Geomap
- In Query:
- Select measurement
client_subnet_country - Add
tag(clientcountry)in Group By - Remove
time($__interval)from Group By - Add
mean()to Select - Format as
Table
- Select measurement
- In Options scroll down to
Data layer:- Change Location to
Lookup - Change Lookup field to
clientcountry - Change Marker color to
mean - Change Marker size to
mean
- Change Location to
Save & Done, enjoy! 😄